Quarterly Market Review: Q3 2020
InvestingDespite some choppiness in September, equity investors were treated to solid gains during the third quarter. The S&P 500 Index rose 8.9% in the quarter and has recovered all its losses for the year. Underneath the surface, mega-cap growth names continue to lead the U.S. market. Without the astonishing 42.5% year-to-date price return of the six so-called FANMAG stocks (Facebook, Amazon.com, Netflix, Microsoft, Apple, and Google/Alphabet), the S&P 500 would still be down for the year.
The outperformance of these top names means they now dominate the index. Market concentration is not unusual, but with the top 10 stocks in the S&P 500 making up 28% of the index, it’s extreme today. The important investment takeaway is to not be lured into chasing the returns of what has worked well in the recent past. These companies’ outsized past returns have come from their ascension to the top, not from owning them once they were already there. Owning the largest stocks has badly lagged owning the diversified index over time.
Nevertheless, this U.S. mega-cap growth effect is driving the outperformance of U.S. stocks versus foreign stocks this year. Developed international stocks gained 6.0% this quarter, almost three percentage points behind U.S. stocks, though, emerging-market stocks outperformed U.S. stocks with a return of 10.2%. Both groups still trail U.S. stocks year to date.
Some of this relative performance is deserved. Unlike in the dot-com era, today’s large U.S. growth firms have created real economic value. This has come at a time when growth has been scarce and interest rates low, so investors have been willing to pay up for their growth. That said, a durable economic recovery taking hold could be the catalyst for investors to turn away from these highflyers and favor undervalued stocks in out-of-favor industries and overseas markets.
Bond markets were calm throughout the summer, thanks in large part to the Federal Reserve’s extremely accommodative monetary policy. Treasury yields were unchanged, and core investment-grade bonds gained 0.6% in the third quarter. Fed officials say they are now targeting “average inflation” of 2% and have signaled that they do not expect to raise rates at least through the end of 2023. Since inflation has not topped the Fed’s target in a decade, many market participants expect low rates and supportive policy to continue for a long time. In riskier segments of the bond market, high-yield bonds and floating-rate loans were each up over 4% but remain slightly negative for the year.
Going into the final quarter of 2020, multiple crosscurrents and uncertainties are presenting both investment opportunities and risks, over the near term and medium to longer term. A unique U.S. election approaches in November. The market doesn’t like uncertainty, so the weeks leading up to the election and afterward may be volatile. But history shows any election-year declines are usually short-lived and the political party in power is not a significant driver of investment returns. Political views have no place in our investment process, and we don’t attempt to predict the short-term market reaction to elections (or any short-term event). There are simply too many other factors that impact markets over time. Instead, we stick to our longer-term analytical framework in which we consider and weigh multiple macro scenarios and assess the potential risks and returns for numerous asset classes and investments in each scenario. The fundamentals are what really drive long-term market performance.


Questions or comments? Don't hesitate to reach out - we'd love to hear from you.
More From Our Site
Common Scams to Be Aware of During the COVID-19 Pandemic
As the Coronavirus Continues, Avoid These 5 Retirement Mistakes
Will the U.S. Election Affect Stock Market Returns?
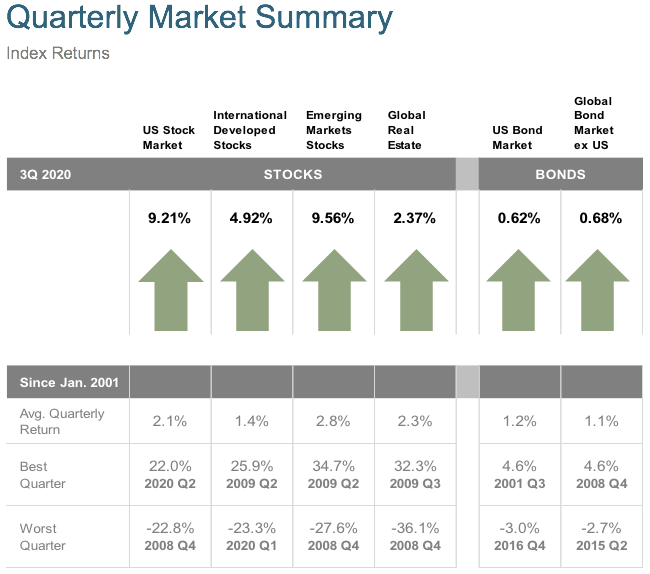
Certain material in this work is proprietary to and copyrighted by Litman Gregory Analytics and is used by CogentBlue with permission. Reproduction or distribution of this material is prohibited and all rights are reserved.Past performance is not a guarantee of future results. Indices are not available for direct investment. Index performance does not reflect the expenses associated with the management of an actual portfolio. Market segment (index representation) as follows: US Stock Market (Russell 3000 Index), International Developed Stocks (MSCI World ex USA Index [net div.]), Emerging Markets (MSCI Emerging Markets Index [net div.]), Global Real Estate (S&P Global REIT Index [net div.]), US Bond Market (Bloomberg Barclays US Aggregate Bond Index), and Global Bond Market ex US (Bloomberg Barclays Global Aggregate ex-USD Bond Index [hedged to USD]). S&P data © 2020 S&P Dow Jones Indices LLC, a division of S&P Global. All rights reserved. Frank Russell Company is the source and owner of the trademarks, service marks, and copyrights related to the Russell Indexes. MSCI data © MSCI 2020, all rights reserved. Bloomberg Barclays data provided by Bloomberg.